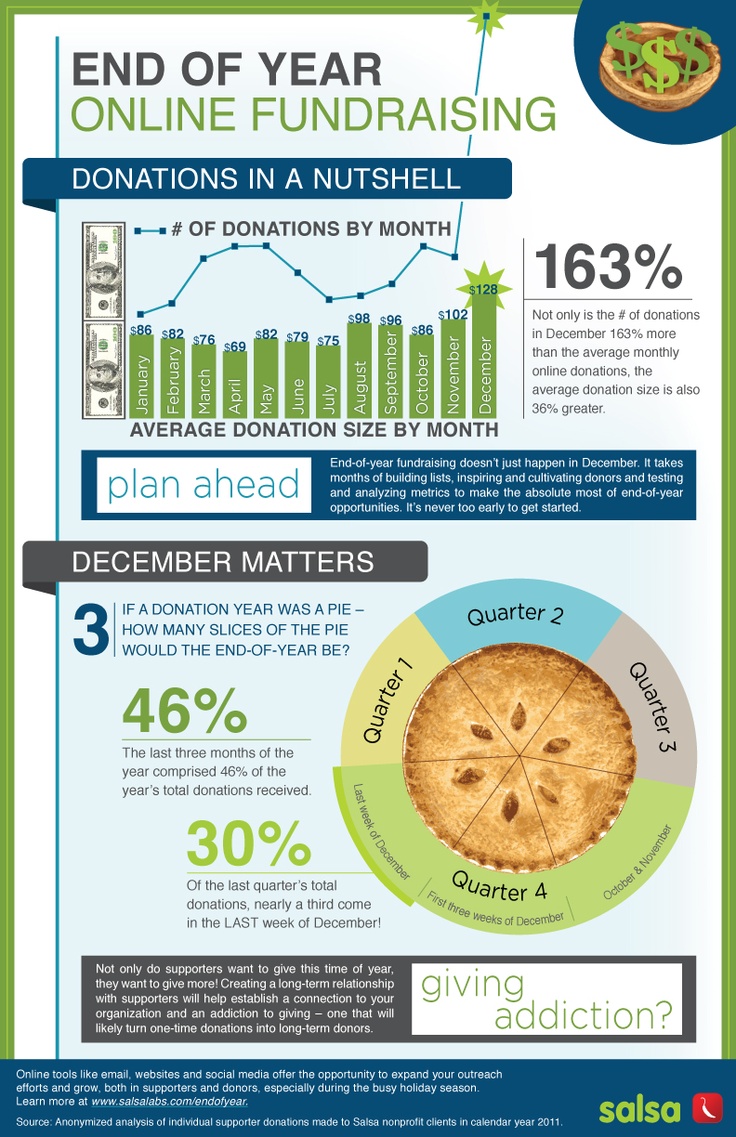
September is the ideal time to begin your end-of-year fundraising campaign. Donations jump 163% in December, and the average gift size increases by 36%! So what are you waiting for? This neat infographic from Salsa Labs features details about end-of-year giving and more. They also have a helpful free e-book you can download, called the Essential Guide to Year End Fundraising for …
Nonprofits, are you still doubting the power of social media?
Still doubting the power of social media? Check out this neat interactive infographic from Digital Insights. Some of the more mind-blowing findings: 75% of the engagement on a Facebook post happens in the first 5 hours – so post frequently (more than once per day if you can); 44% of Twitter users have never sent their own tweets, but don’t …
Which Nonprofit Causes Rule Social Media?
Have you ever wondered which nonprofit organizations, causes and issues get the most engagement and exposure on social media? Check out this great infographic by the RAD Campaign and Craig Newmark’s Craigconnects. The findings may surprise you! The infographic also includes quotes and tips from nonprofit online engagement specialists and marketing managers. Find more great infographics on NerdGraph Infographics
What Is Your Organization’s Social Media Workflow?
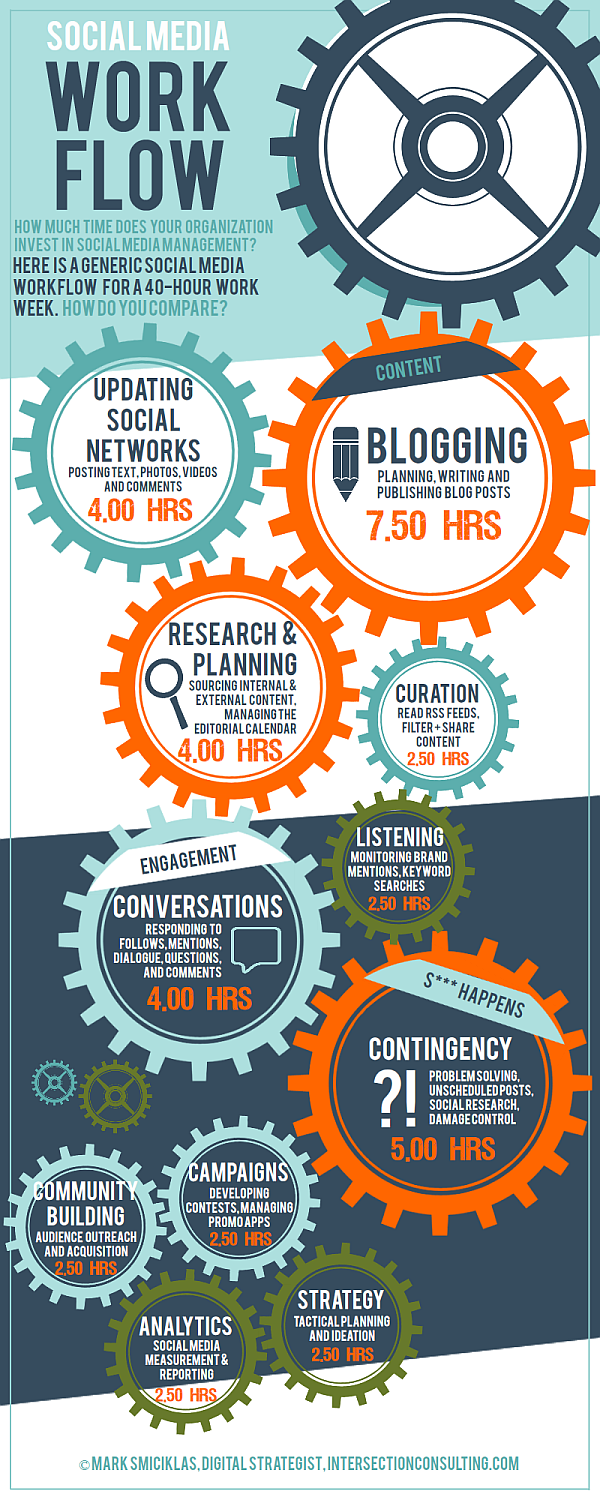
There is a misconception that the work of social media is easy – simple posting and tweeting. How hard can it be? If you do it well, it is much more than that. Mark Smiciklas, Digital Strategist at Intersection Consulting, Ltd., created a great infographic depicting how much time organizations invest in social media management. He examined a typical social …
Nonprofits Grew Online Giving, Website Traffic & Social Media Fans in 2013
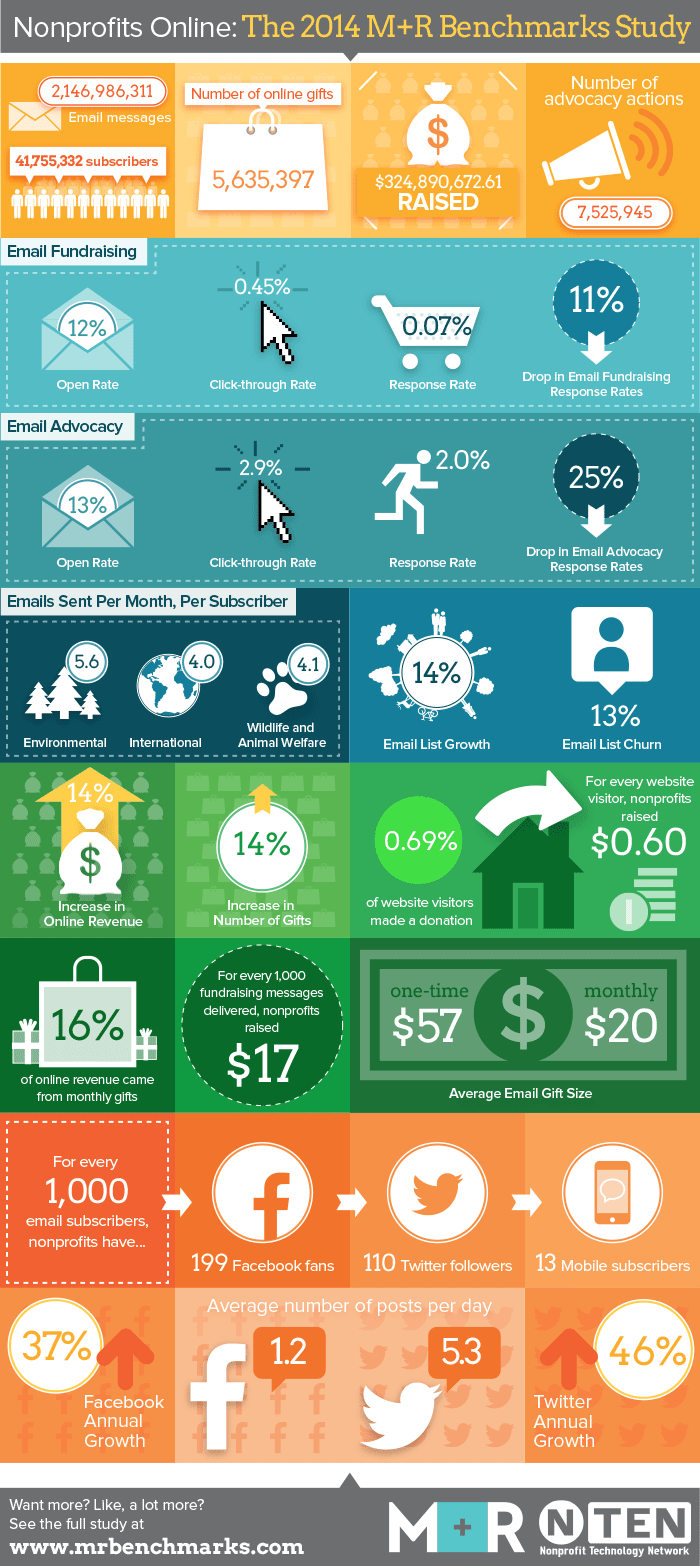
It’s that time of year again – the M+R and NTEN annual Nonprofit Benchmarks Study! This year they surveyed 53 nonprofits, looking at data on online fundraising and advocacy. Some of the more interesting findings: Email continues to account for about a third of online fundraising revenue. Online giving increased 14% over 2012 totals. Monthly website traffic grew by 16% in …
How To Create Eye-Catching Graphics For Your Nonprofit (Without Using Photoshop!)
I presented a great webinar this week with 4Good and Nonprofit Webinars, and I am happy to share it with you here. You can also read more in my free e-book! Summary: There is no doubt that visuals are driving online communications in 2014. Our minds react differently to visual content. On Facebook, videos are shared 12X more than links and …
Small Nonprofits Are Increasing Their Online Fundraising
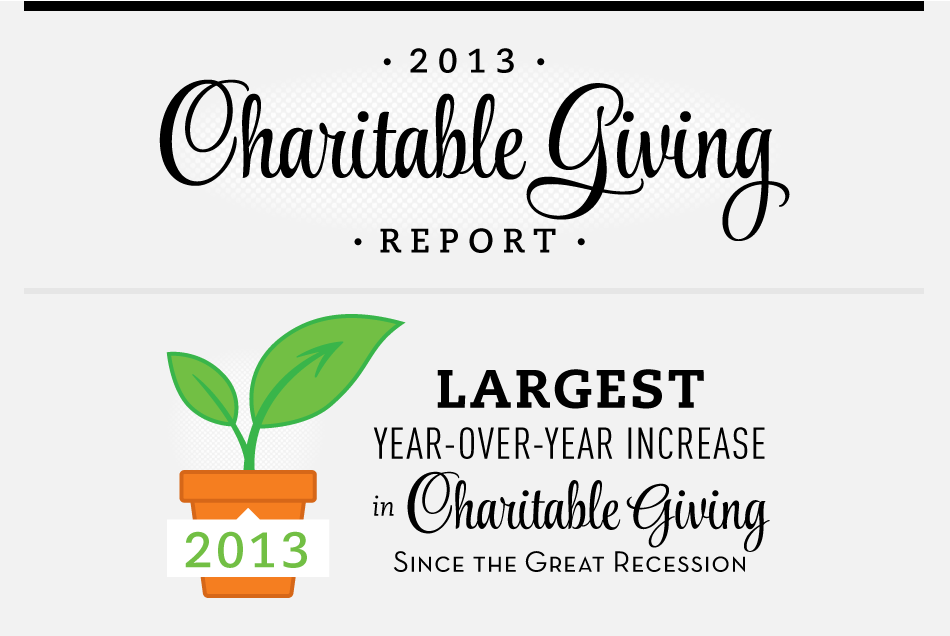
Last week Blackbaud released it’s annual Charitable Giving Report, and the findings may surprise you. The fundraising climate is improving. Overall giving in the U.S. was up by almost 5%! Not surprisingly larger nonprofits grew their giving by 5.7% compared to smaller organizations, which grew at 3.6% Most notably, online giving is on the rise. It grew 13.5% in 2013, …
5 Great Nonprofit Infographics to Learn From
As I’ve established in previous blog posts, having compelling, eye-catching and provocative visuals is a necessity for nonprofit marketing campaigns. Nonprofit marketers should be constantly keeping an eye out for provocative infographics, whether you are sharing them on Pinterest or using them to communicate with donors and stakeholders. Creating original infographics about your organization and your cause are the best …
Happy Birthday Dear Facebook – Facebook Turns 10!
Love it or hate it, the social network turns 10 years old today! In an open letter on his Facebook profile, Mark Zuckerberg writes: Check out this nifty infographic from marketing agency Keystone Click, detailing some of the major changes from TheFacebook.com in 2004 to Facebook as we know it today. Resources: Facebook Turns 10: What If It Had Never Been …
